What is a Star Schema (and why it’s important)
A Star Schema is a data modelling technique used to model the presentation layer of a Data Warehouse. It refers to the way Facts and Dimensions in the model are related. A Star Schema is organized around a central fact table that is related to its Dimension tables using foreign keys in the Fact table.
The name “Star” schema refers to the star-like pattern that emerges when you present the Fact table and its Dimensions in an entity-relationship diagram.
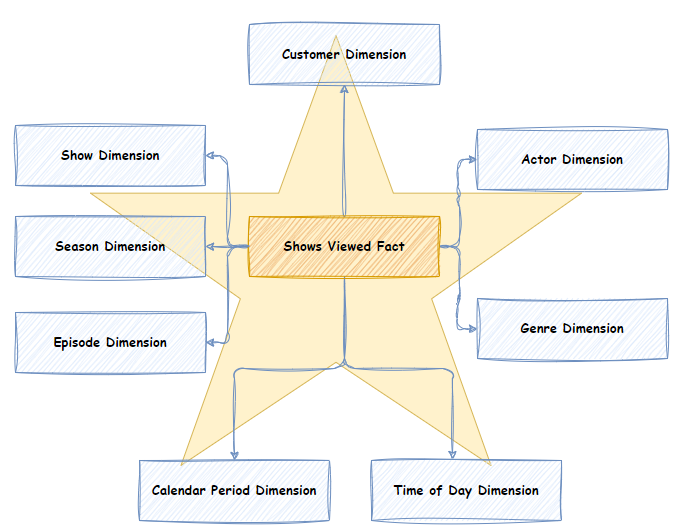
The image above is an example of a Star Schema. It depicts an imaginary video streaming company, GetFlix, and a “Shows Viewed” Fact table. The “Shows Viewed” fact table is at the centre of the star schema and surrounded by its Dimensions, which form the points of the “star.”
Benefits of Star Schemas
A Star Schema focuses on delivering simplicity and query performance for the end user. The benefits include:
- It is easy for users to understand and navigate. Users can easily find and use the data they need for reporting and ad hoc analysis.
- Because of its simplified joins, a Star Schema supports high-performance aggregated queries. It performs well over many different analytics use cases.
- Broadly accepted and used across the industry.
- The source schema expected by Semantic layer tools. These tools can consume Star Schemas as is and apply various compression and pre-aggregation techniques to further enhance aggregated analytical query performance.
- The source schema expected by visualization tools like PowerBI and Tableau. They support these tools’ drag-and-drop nature.
- Eliminates issues present in “third normal form” (3NF) schemas, where multiple alternate join paths can produce different or incorrect query results from the same data. For example, in a Star schema, there is only one way to join “Shows Viewed” to Customer, whereas in a 3NF schema, there may be multiple ways to join from “Shows Viewed” to Customer.
The 3 essential building blocks of a Star Schema
A Star Schema consists of two types of tables (Facts and Dimensions) and their relationships. Thus, it’s simplicity.
The following is a brief introduction to these concepts.
Facts tables
A Fact table represents a business process or an event in a business process. It contains the measures/numbers you want to analyse. For example, the “GetFlix” “Shows Viewed” fact table depicted in the star schema example below contains one row for every time a customer views an Episode of a Show. “Customer views an Episode of a Show” is the business event we are measuring.
Read more about Fact Tables.
Dimensions
A Dimension represents a business entity, which is the people, places, and things that come together to perform business activities. A Dimension contains the attributes (i.e. fields) of the business entity, e.g., Customer Gender, Age, Category, etc. The attributes are used to filter and group fact data when performing data warehousing queries. Attributes values should be descriptive values rather than codes (e.g. “Male” instead of “M”). The reason is that attribute values become column headings in a report. A column heading of “M” is not very informative.
This demonstrates one of the key differences between a Star Schema and a 3NF schema. A Dimension contains descriptive attributes and a lot of data redundancy. It doesn’t follow the conventional ideas of 3rd normal form (3NF) modelling. It is like this on purpose. That is often a hurdle that DBAs and application developers, coming from a traditional database background, need to overcome before they can fully embrace Dimensional modelling concepts.
Read more about Dimensions.
Star Schema Relationships
A Star Schema is a simplified model suitable for reporting and analytics with easy relationship navigation for end users. The image below depicts the relationship between a Fact and a Dimension.
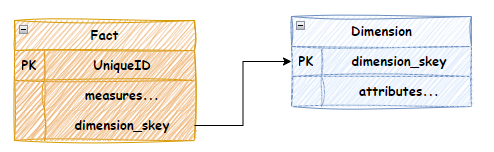
The rules for relationships are very simple. The direction of a relationship is always from a Fact to a Dimension. That is, the Fact contains the foreign key to the Dimension. The cardinality is always 1 to many. A Fact is related to only 1 Dimension row, but a Dimension row can be related to many Fact rows. There are many-to-many joins, but this is resolved through an intermediary “Group” Dimension and “Bridge” fact with two 1-to-many relationships. Read more about dimensional many-to-many relationships.
The best practice is to always have surrogate keys on Dimensions. Therefore, the foreign key on the Fact table is related to the surrogate key of the dimension.
Star Schema vs Snowflake Schema
The Star and Snowflake schemas are two types of Dimensional modelling techniques used in Data Warehousing to organize and structure data for efficient querying and analysis.
Below is the model for a Sales Fact Star Schema vs. a Snowflake Schema for the same Fact.
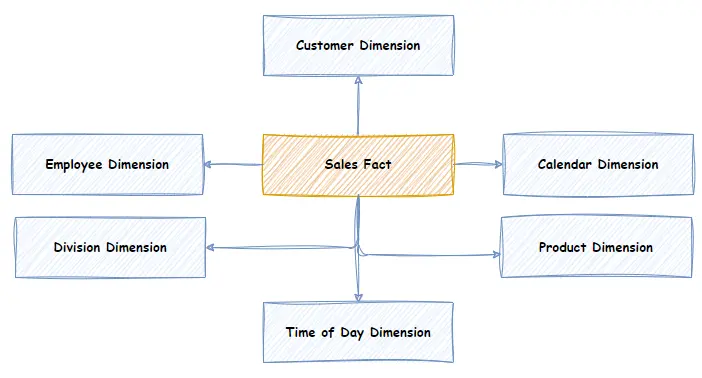
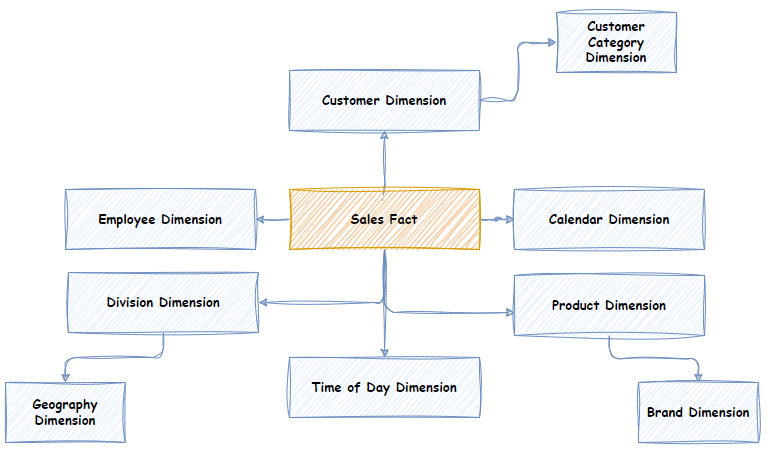
In the Star schema example, the Product Dimension contains an attribute for the “Brand” of the Product, whereas the Snowflake schema has a separate Brand Dimension with a “snowflake” relationship to the Product Dimension. This is the crucial difference between the Star Schema and the Snowflake Schema. In the Snowflake schema, attributes are normalised into separate Dimensions, whereas they are Denormalised in the Star Schema. The same data exists in the models; just where it is stored is different.
The only advantage of Snowflake Schema is less storage, and in the modern data warehouse, storage is no longer an issue, especially considering Dimensions are usually relatively small compared to Facts. The Star Schema is easier to design and maintain, is easier to understand and navigate, and offers faster performance.
Our recommendation is never to use the Snowflake Schema.
Read more about Star schema vs Snowflake schema.
Star Schemas and Conformed Dimensions
So far, we have discussed using a Star Schema. However, a Star Schema only describes the model for a single Fact table. An Enterprise data warehouse should model many different business processes/events, each with its own Fact table and related Dimensions.
The question is, how do we prevent duplication of the Dimensions used by Facts and facilitate cross-business process analysis?
The answer is “Conformed” Dimensions. Essentially, a conformed Dimension is a Dimension shared by many Facts. Typical conformed Dimensions are key business entities like Employees, Customers, Products, Cost Centres, Dates, and Times. Conformed Dimensions are the “links” between multiple Star Schema models.
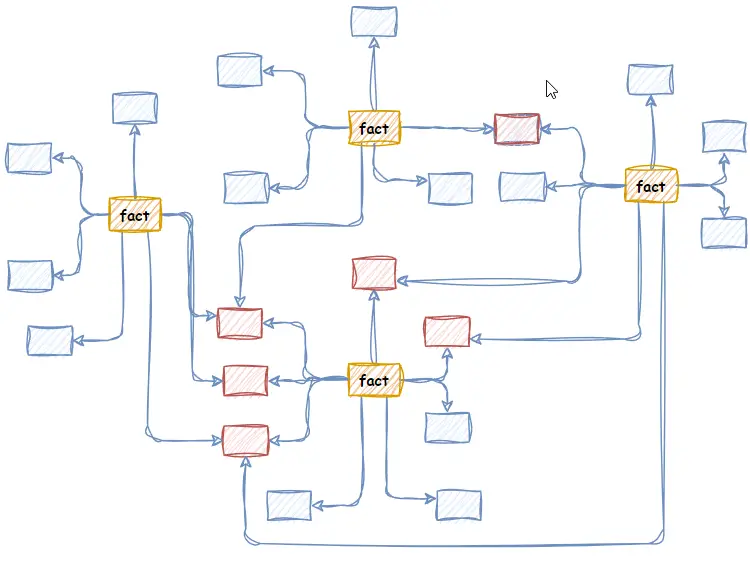
When two Fact tables share a Dimension, you can produce a report with measures side-by-side from both Fact tables, categorized or filtered by attributes of their conformed (i.e. shared) Dimensions. In this way, dimensional modelling with conformed Dimensions supports enterprise-wide cross-business process analysis.
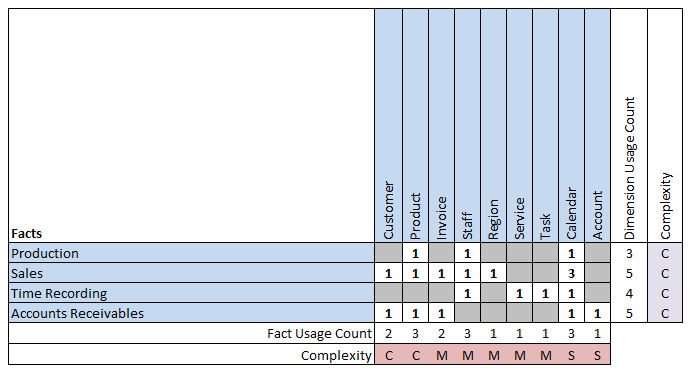
Another way of representing conformed dimensions is through a data warehouse matrix.
How to build a Star Schema
Below is the image of the physical Fact table and its Dimensions, implemented in a relational database. The key thing to note is that each Dimension has a surrogate key, and the Fact table has a foreign key to each of those surrogate keys. You may be wondering why there are no physical relationships depicted. This is because, in this case, each table is implemented with a ColumnStore index, and no primary keys are defined. ColumnStore indexes are ideal for analytical style aggregated queries (basically an index on every attribute) and ETL bulk loads. Also, generally speaking, Primary Keys and Clustered indexes will slow down your ETL Load. The foreign to primary key relationships still exist but are not physically implemented.
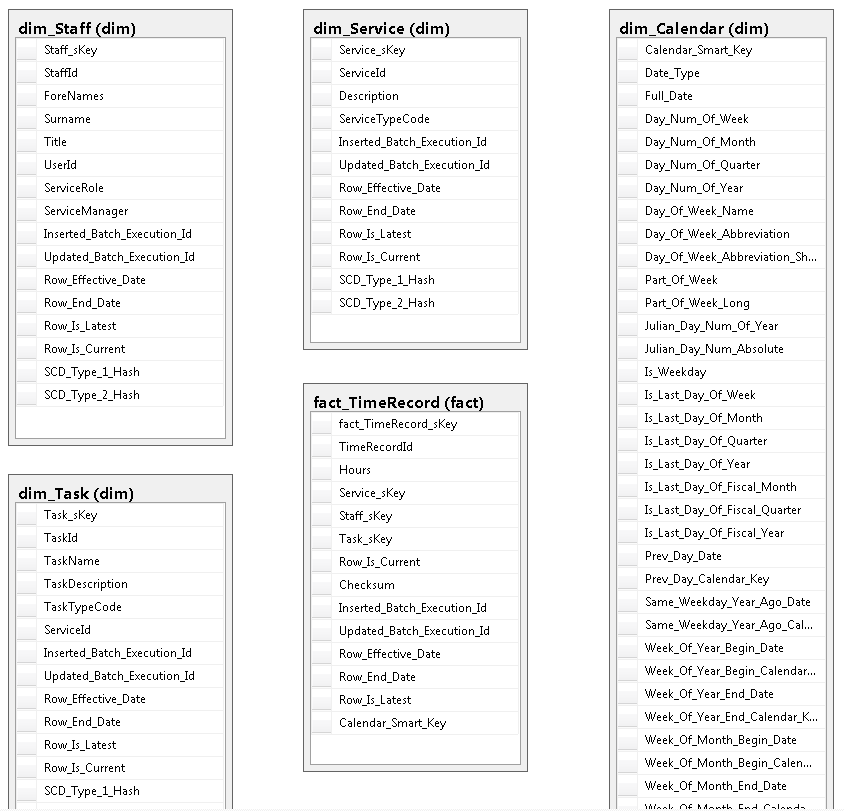
The full details of the above table schema can be found in the Dimension and Fact articles.
Why you should use Star Schema in Visualization tools like PowerBI
The Star Schema design is crucial for creating Power BI semantic models that are both high-performing and user-friendly.
Each visual in a Power BI report generates a query sent to the Power BI semantic model. These queries filter, group, and summarize the data within the model. An effectively designed model offers tables for filtering and grouping and tables for summarization. This aligns seamlessly with the star schema’s Dimensions and Facts. Dimensions support the filtering and grouping function, while Fact tables support summarization.
From a performance perspective, it has been proven that Star schemas are more performant than “flattened” “one big table” (OBT) tables when used in PowerBI.
- The Star schema is much faster for retrieving values for columns in slicers. This is important for useability.
- The Star Schema model is much smaller. Dimensional models are far more compressible. They consume less memory.
- The Star Schema is faster for more complex queries, and when the flatted model is faster, it’s not by much. Performance is even worse for 3NF models.
- Furthermore, it’s been demonstrated that “flattened” tables can produce inaccurate numbers.
It’s likely that Tableau and other visualization tools experience the same results.
The conclusion here is that Star Schemas are the best schema to use in semantic models that support visualization tools.
Star Schema vs 3rd Normal Form 3NF
The star schema and third normal form (3NF) schema are both database design methodologies, but they serve different purposes and have distinct structures.
3NF is intended for use in operational (OLTP) systems where data integrity and minimization of redundancy are critical. It supports write-heavy operations, ensuring data consistency and efficiency in updates.
Tables are organized to eliminate redundancy and ensure that each piece of data is stored only once. Tables are normalized, which involves dividing data into multiple related tables.
3NF does not perform well for aggregated analytical queries due to the need to involve multiple tables with many joins. Tables are optimized for data integrity and efficient updates rather than read performance.